Construction Air Quality Monitoring Dashboard
Community Air Quality Monitoring Dashboard
Battery Park City Resiliency Project — Resident-Friendly Monthly Summary
GTA is tracking these reports on behalf of residents because the official air monitoring documents are technical and not easy for most residents to interpret. Our goal is to identify recurring concerns, explain them clearly, and press BPCA and its contractors for reliable monitoring, transparent reporting, and stronger dust prevention before problems affect residents.
First, What Are We Measuring?
The official reports use technical terms like PM10, PM2.5, and VOC (Volatile Organic Compounds, generally vapor or chemical-type readings). Here is what those mean in plain English.
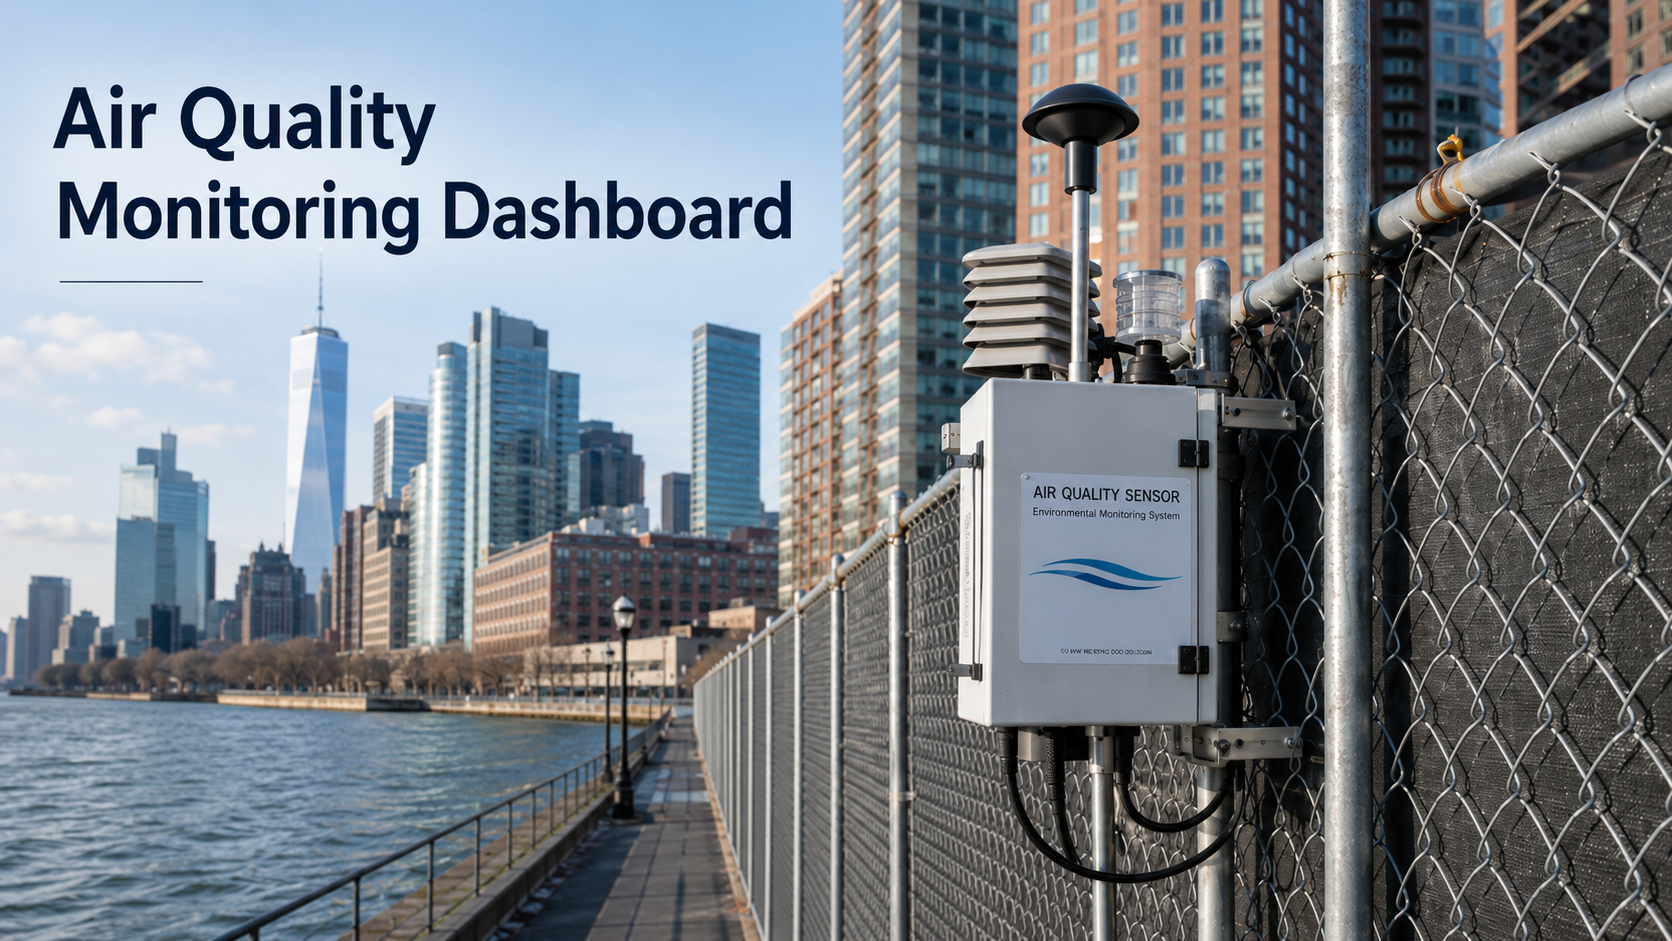
PM = Particle Pollution
PM stands for particulate matter. In everyday terms, this means tiny particles in the air, including dust, dirt, soot, smoke, or particles created by construction activity.
PM10 = Larger Dust
PM10 refers to larger airborne particles. For residents, this is often the kind of dust most associated with demolition, excavation, soil, debris, and windblown construction material.
PM2.5 = Finer Particles
PM2.5 refers to much smaller particles. These can be more concerning for people with asthma, respiratory conditions, heart or lung conditions, older adults, and young children.
Current At-a-Glance Status
No sustained PM10 or PM2.5 regulatory exceedances reported.
No vapor or chemical exceedances reported in the reviewed months.
Short-term 15-minute PM events reported in March 2026.
Reach 5 has been the recurring hotspot in the reviewed reports.
Month-by-Month KPI Summary
| Month | Areas Monitored | 24-Hour PM Exceedances | VOC Exceedances | PM10 Short-Term Events | PM2.5 Short-Term Events | Total Short-Term PM Events | Main Reported Causes | GTA Watch Item |
|---|---|---|---|---|---|---|---|---|
| Dec. 2025 | Reach 5, Reach 6 | 0 | 0 | 15 | 10 | 25 | Paver demolition, site preparation, test pits, Upper Room demolition | Active demolition dust |
| Jan. 2026 | Reach 1, Reach 5, Reach 6 | 0 | 0 | 5 | 0 | 5 | Wind gusts blowing loose soil during off-hours | After-hours soil stabilization |
| Feb. 2026 | Reach 1, Reach 5, Reach 6 | 0 | 0 | 14 | 5 | 19 | Windblown soil, slab demolition, equipment exhaust, saw-cutting/chopping | Dust control and equipment idling |
| Mar. 2026 | Reach 1, Reach 3, Reach 5, Reach 6 | 0 | 0 | 16 | 11 | 27 | Excavation, hand chopping, tree removal, exposed loose soil, wind events | Reach 5 and off-hours wind events |
As BPCA publishes additional monthly reports, a new row will be added to this table.
Monthly Trend: Short-Term Dust Events
These are 15-minute PM10 and PM2.5 exceedance events. They are not the same as sustained 24-hour regulatory exceedances, but they are useful indicators of construction dust-control performance.
PM10 vs. PM2.5 Events
PM10 is larger dust often associated with construction activity. PM2.5 is finer particle pollution and can be more concerning for residents with asthma, respiratory conditions, heart/lung conditions, older adults, and young children.
Where Are the “Reaches”?
The official reports divide the project into construction zones called reaches. Most residents will not know these technical labels, so GTA is translating them into more familiar neighborhood areas.
What Caused the Short-Term Dust Spikes?
| Cause Category | What It Means | Resident Concern |
|---|---|---|
| Demolition / paver removal | Breaking or removing hard surfaces can create dust. | Needs wetting, containment, and careful work sequencing. |
| Excavation / hand chopping | Digging and breaking material can release dust. | Needs water, barriers, and close monitoring. |
| Saw-cutting / chopping | Cutting concrete or similar material can create intense short-term dust. | Should be controlled directly at the source. |
| Windblown loose soil | Exposed soil moves during gusts, often after work hours. | Suggests need for better end-of-day, weekend, and pre-storm stabilization. |
| Equipment exhaust / idling | Diesel or equipment exhaust can affect PM2.5 readings. | Equipment should not idle near monitors, buildings, or pedestrian areas. |
Resident-Friendly Interpretation
What is reassuring?
- No reported sustained 24-hour PM10 or PM2.5 regulatory exceedances.
- No reported VOC exceedances.
- Most short-term events reportedly dropped below action levels by the next monitoring interval.
What remains concerning?
- Recurring short-term dust spikes, especially PM10.
- Windblown loose soil during off-hours.
- Reach 5 appears to be a recurring hotspot.
- Power interruptions and monitor downtime reduce confidence in continuous monitoring.
GTA Watch List for BPCA / Project Team
| Question / Watch Item | Why It Matters to Residents |
|---|---|
| How is loose soil stabilized after hours, on weekends, and before windy weather? | Several exceedances were attributed to windblown loose soil when the contractor was not working. |
| Can monitor power outages be reduced? | Residents need confidence that air monitoring is continuous and reliable. |
| Can BPCA publish a simple monthly public dashboard? | The official reports are technical and difficult for many residents to interpret. |
| Can dust controls be more proactive rather than reactive? | Many events were short-lived, but repeated events suggest prevention should be strengthened. |
| Can report errors or inconsistencies be corrected? | Accurate, clear reporting is important for public trust. |
How to Read This Dashboard
PM10: Larger dust particles often associated with construction, demolition, soil, and debris.
PM2.5: Finer particles that can be more concerning for people with respiratory or heart conditions.
VOC: Volatile Organic Compounds, generally vapor or chemical-type readings.
15-minute exceedance: A short-term reading above a project action level. It does not necessarily mean the air exceeded a full-day regulatory standard.
24-hour exceedance: A longer-term regulatory exceedance measured over a full day. The reports reviewed did not identify these for PM10 or PM2.5.