Air Quality Monitoring Dashboard-As of July 31, 2026
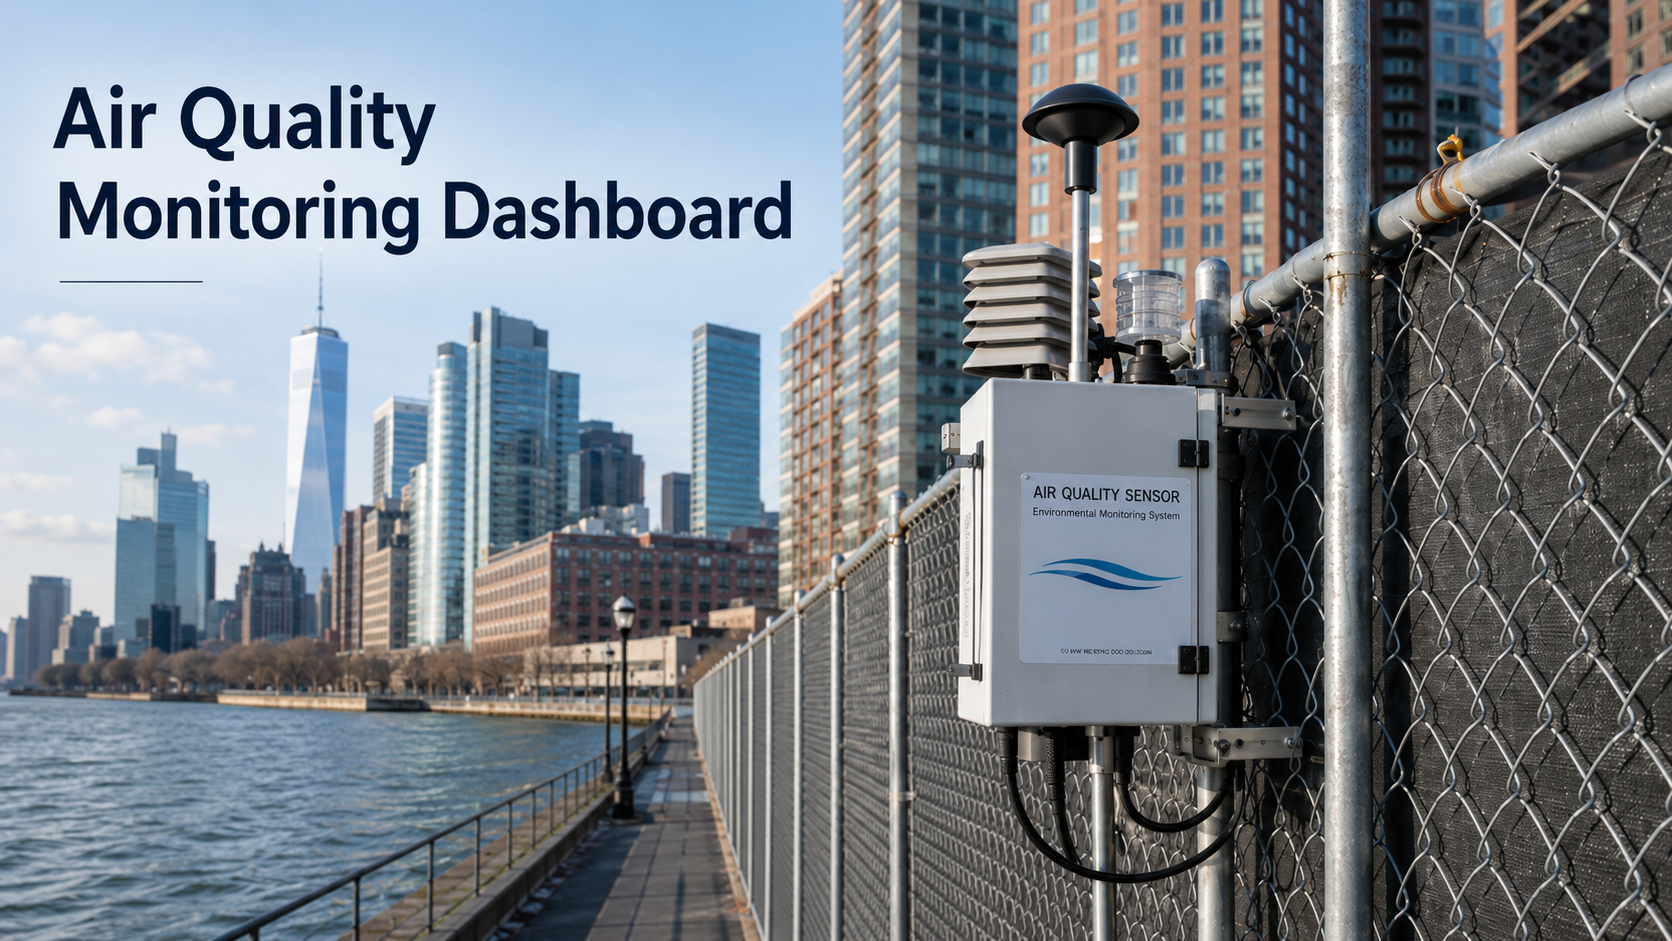
Community Air Quality Monitoring Dashboard
Battery Park City Resiliency Project — Resident-Friendly Monthly Summary
GTA is tracking these reports on behalf of residents because the official air monitoring documents are technical and not easy for most residents to interpret. Our goal is to identify recurring concerns, explain them clearly, and press BPCA and its contractors for reliable monitoring, transparent reporting, and stronger dust prevention before problems affect residents.
First, What Are We Measuring?
The official reports use technical terms like PM10, PM2.5, and VOC. Here is what those mean in plain English.
PM = Particle Pollution
PM stands for particulate matter. In everyday terms, this means tiny particles in the air, including dust, dirt, soot, smoke, or particles created by construction activity.
PM10 = Larger Dust
PM10 refers to larger airborne particles. For residents, this is often the kind of dust most associated with demolition, excavation, soil, debris, and windblown construction material.
PM2.5 = Finer Particles
PM2.5 refers to much smaller particles. These can be more concerning for people with asthma, respiratory conditions, heart or lung conditions, older adults, and young children.
Current At-a-Glance Status
No sustained PM10 or PM2.5 regulatory exceedances reported in the reviewed months.
No VOC exceedances reported in the reviewed months.
67 individually enumerated short-term PM events, plus additional wildfire-related PM2.5 exceedances reported only as “numerous.”
Reach 5 remains the largest explicitly enumerated hotspot; Reach 7 also remained highly active.
Monitoring Coverage Concern
GTA continues to track unresolved monitoring coverage questions near Gateway. On May 8, BPCA announced that work near Gateway would begin on May 11. GTA asked BPCA to confirm whether noise, air, and vibration monitoring was in place for this work, and BPCA responded that monitoring was in place.
GTA later learned that noise and air monitoring equipment for this Gateway-adjacent work area was not installed until June 10. The June report appeared to confirm Reach 5E monitoring beginning on June 10. BPCA has not provided GTA with a satisfactory written explanation of the earlier representation.
July update: The July report continues to identify this Gateway-adjacent work as Reach 5E and reports micropile installation and grouting there. GTA continues to believe this area corresponds to Reach 6A North and is concerned that the earlier monitoring gap may have caused May and early-June conditions to be underrepresented.
The July report also introduces another coverage concern: it states that two Reach 2 monitors were installed on July 30, meaning the “no exceedances” finding for Reach 2 does not represent a full month of monitoring. In addition, monitoring at Reach 6 Albany Street concluded on July 7.
Why this matters: Monthly “zero exceedance” or low-event findings should be interpreted in the context of when monitors were actually operating. GTA is asking BPCA to publish a simple monitor-coverage calendar showing installation dates, removals, outages, and periods when site-contribution calculations were unavailable.
Monitoring Methodology and Siting Concern
The project’s own methodology has important limitations that residents should understand. The report states that Site Contribution is calculated by comparing upwind and downwind monitors based on wind speed and direction. If wind speed is below 1 mph, the downwind station is considered undetermined and Site Contribution is absent from the data plot.
This matters because calm or very-low-wind conditions can reduce the project team’s ability to attribute elevated particulate readings to construction. GTA is asking BPCA to disclose, by reach and month, the percentage of 15-minute intervals below 1 mph, how many Site Contribution calculations were unavailable, and whether high individual-monitor readings occurred during those periods.
Reach 5E / Gateway-adjacent siting: GTA is also concerned that the two monitors serving the Reach 5E / Reach 6A North work area are positioned largely along a north-south axis while winds can frequently move west-to-east. A north-south pair may not consistently function as a true upwind/downwind pair when dust moves east toward nearby residents and public areas.
The contrast with Reach 7 is notable: the July report states that Reach 7 used six stationary monitors, while the specific Gateway-adjacent Reach 5E work area appears to rely on a much more limited configuration. GTA is asking BPCA to publish the monitor-siting rationale and explain whether an east-side or receptor-side monitor should be added near Gateway.
Data Confidence and Transparency Note
GTA summarizes the monthly air monitoring reports for residents in plain English. Dashboard numbers are based on the exceedance entries and monitoring information published in the official reports; GTA has not independently recalculated every 15-minute reading from the raw monitoring data.
The July report was issued on August 28 but only released by BPCA on September 16, 2026. for the July 1–31 reporting period and was prepared by Enovate Engineering, identified as a subconsultant to Turner-SPC JV. GTA continues to believe residents would have greater confidence if BPCA provided direct public access to the underlying monitoring data, monitor status, exceedance alerts, and independent review of monthly results.
July reporting limitation: The report repeatedly describes mid-July PM2.5 exceedances associated with Canadian wildfire smoke as “numerous,” without giving an exact total in the narrative. Because of that change in reporting style, July cannot be compared cleanly with prior monthly event totals. GTA has separated the 67 individually enumerated events from the additional, unquantified wildfire-related PM2.5 events.
GTA is also concerned by continuing monitor power disconnections. Based on the outage periods listed in the July report, there were roughly 437 cumulative monitor-hours of listed power disconnections across the project, including approximately 250 monitor-hours in Reach 7 alone. These are cumulative monitor-hours, not 437 hours when the entire project was unmonitored, because multiple monitors operate simultaneously.
Month-by-Month KPI Summary
| Month | Areas Monitored | 24-Hour PM Exceedances | VOC Exceedances | PM10 Short-Term Events | PM2.5 Short-Term Events | Total Short-Term PM Events | Main Reported Causes | GTA Watch Item |
|---|---|---|---|---|---|---|---|---|
| Dec. 2025 | Reach 5, Reach 6 | 0 | 0 | 15 | 10 | 25 | Paver demolition, site preparation, test pits, Upper Room demolition | Active demolition dust |
| Jan. 2026 | Reach 1, Reach 5, Reach 6 | 0 | 0 | 5 | 0 | 5 | Wind gusts blowing loose soil during off-hours | After-hours soil stabilization |
| Feb. 2026 | Reach 1, Reach 5, Reach 6 | 0 | 0 | 14 | 5 | 19 | Windblown soil, slab demolition, equipment exhaust, saw-cutting/chopping | Dust control and equipment idling |
| Mar. 2026 | Reach 1, Reach 3, Reach 5, Reach 6 | 0 | 0 | 16 | 11 | 27 | Excavation, hand chopping, tree removal, exposed loose soil, wind events | Reach 5 and off-hours wind events |
| Apr. 2026 | Reach 1, Reach 3, Reach 5, Reach 6, Reach 7 | 0 | 0 | 37 | 10 | 47 | Moving equipment, windblown dust, plywood barriers, waterfront work, Pumphouse Park work, subcontractor vehicles/materials, dewatering tanks, tree trimming, concrete deadman work | Sharp increase in short-term dust events; Reach 5 remained highest, Reach 7 newly active, Reach 6/Gateway dewatering-related events |
| May 2026 | Reach 1, Reach 3, Reach 5, Reach 6 Albany, Reach 6 Rector, Reach 7 | 0 | 0 | 75 | 25 | 100 | Construction activities, subcontractor activities, wind-blown dust, concrete demolition, garden-hose/wetted-soil mitigation, improper generator operation, tree/surface demolition and utility-related work | Highest month at that time; Reach 5 remained dominant hotspot, Reach 7 remained active, after-hours/weekend wind-blown dust and monitor outages needed stronger controls |
| June 2026 | Reach 1, Reach 3, Reach 5B/5C/5D, Reach 5E, Reach 6 Albany, Reach 6 Rector, Reach 7 | 0 | 0 | 130 | 64 | 194 | Active construction, Reach 1 night work, wind-blown dust, micropile drilling / Reach 5E, utility work, wetting and dust-control measures | Highest month so far; Reach 5 remains dominant, Reach 1 night work needs scrutiny, Reach 5E monitoring appears to begin June 10, and report-quality / monitor-outage issues require explanation |
| July 2026 | Reach 1, Reach 2*, Reach 3, Reach 4, Reach 5B/5C/5D, Reach 5E, Reach 6 Albany**, Reach 6 Rector, Reach 7 | 0 | 0 | 47 | 20 + numerous wildfire-related | 67+ | Active construction, wind-blown dust, site demolition, micropile installation/grouting, utility work, sheet pile work, and regional Canadian wildfire smoke | Not directly comparable with June because wildfire-related PM2.5 events were not numerically totaled; Reach 5 and Reach 7 remain key watch areas; monitor outages and partial-month coverage require context |
July note: * Reach 2 monitors were installed July 30, so its zero-exceedance result does not represent a full month. ** Reach 6 Albany Street monitoring concluded July 7. July totals show 67 individually enumerated PM events; additional wildfire-related PM2.5 exceedances were described only as “numerous” and are not included in the numeric total.
Monthly Trend: Short-Term Dust Events
These are 15-minute PM10 and PM2.5 exceedance events. They are not the same as sustained 24-hour regulatory exceedances, but they are useful indicators of short-term air-quality conditions and construction dust-control performance.
PM10 vs. PM2.5 Events
PM10 is larger dust often associated with construction activity. PM2.5 is finer particle pollution and can be more concerning for residents with asthma, respiratory conditions, heart/lung conditions, older adults, and young children.
Where Are the “Reaches”?
The official reports divide the project into construction zones called reaches. GTA translates those labels into more familiar neighborhood areas and highlights monitoring issues that affect how the monthly numbers should be interpreted.
What Caused the Short-Term Dust Spikes?
| Cause Category | What It Means | Resident Concern |
|---|---|---|
| Active construction | Many July PM10 and PM2.5 events were attributed to construction activities, including demolition, utility work, support-of-excavation work, micropile installation/grouting, and sheet pile work. | Repeated events should trigger clearer reporting of the specific activity, preventive controls used before work began, and whether work methods were changed after repeated exceedances. |
| Wind-blown dust | Multiple PM10 events occurred outside active work periods and were attributed to dust blowing across the site. | Recurring off-hour dust supports GTA's continuing request for stronger end-of-day, weekend, and pre-storm stabilization. |
| Canadian wildfire smoke | The report attributes numerous PM2.5 exceedances during roughly July 14–18 to regional smoke affecting the Northeast rather than project construction. | The regional explanation may be reasonable, but the report should still provide exact counts and show the evidence used to distinguish regional background from project contribution. |
| Micropile installation / Reach 5E | July construction included micropile installation and grouting in Reach 5E. | This is the Gateway-adjacent area where GTA has already raised concerns about delayed monitor installation and monitor siting. |
| Monitor outages | The July report lists many power disconnections across multiple reaches, including a particularly large number in Reach 7. | Outages reduce data completeness and should be addressed through backup power, better power management, redundancy, or prompt public disclosure. |
| Partial-month monitoring | Reach 2 monitors were installed July 30, and Reach 6 Albany monitoring concluded July 7. | Monthly summaries should clearly distinguish full-month coverage from partial-month coverage so residents do not read a low or zero count as a full-month result. |
| Low-wind methodology | The report states that Site Contribution is unavailable when wind speed is below 1 mph because the downwind monitor is considered undetermined. | BPCA should disclose how often this occurs and whether elevated individual-monitor readings are still investigated during those periods. |
Resident-Friendly Interpretation
What is reassuring?
- No reported sustained 24-hour PM10 or PM2.5 regulatory exceedances.
- No reported VOC exceedances.
- The report distinguishes the mid-July regional wildfire smoke episode from construction-related impacts rather than automatically attributing all PM2.5 elevations to the project.
- Many construction-related short-term events reportedly returned below action levels after wetting or other dust-control measures.
What remains concerning?
- July's true short-term PM total cannot be determined from the narrative because wildfire-related PM2.5 exceedances are described only as “numerous.”
- Reach 5 remains the largest explicitly enumerated hotspot.
- Reach 7 remained highly active and experienced extensive monitor power disconnections.
- Reach 2's zero-exceedance finding reflects monitors installed only on July 30, not a full month.
- Reach 6 Albany monitoring ended July 7.
- The Reach 5E / Gateway-adjacent monitor-start and siting concerns remain unresolved.
- The report's Site Contribution method is unavailable when wind is below 1 mph, but the report does not provide a resident-friendly summary of how often that occurred.
- Repeated Action Level 2 events still are not accompanied by sufficiently detailed public reporting about stop-work decisions, re-evaluation, and permanent corrective action.
GTA Watch List for BPCA / Project Team
| Question / Watch Item | Why It Matters to Residents |
|---|---|
| What is the exact July PM event total? | The report individually enumerates 67 PM events but separately describes numerous wildfire-related PM2.5 exceedances without an exact count. BPCA should publish the complete July total and clearly separate project-related, regional, isolated, and indeterminate events. |
| What specific corrective actions are being taken in Reach 5? | Reach 5 remains the largest explicitly enumerated hotspot and includes the Gateway-adjacent Reach 5E area where micropile installation and grouting continued. |
| Why were Reach 2 monitors installed only on July 30? | The report lists no Reach 2 exceedances, but the monitoring period was only the final part of the month. BPCA should explain what work occurred before installation and how that period was monitored. |
| Why did monitoring at Reach 6 Albany Street conclude July 7? | Residents need to know whether work or potential impacts continued after monitoring ended and what alternative coverage, if any, remained in place. |
| Was Gateway-adjacent work fully and properly monitored? | GTA continues to seek an explanation for the May 11–June 10 monitoring discrepancy and for the current Reach 5E / Reach 6A North monitor configuration. |
| Is the Reach 5E monitor layout adequate for prevailing winds? | If the two monitors are positioned mainly north-south while winds often move west-east, they may not consistently provide a meaningful upwind/downwind comparison. BPCA should publish its siting rationale and consider an east-side or receptor-side monitor. |
| How often was Site Contribution unavailable because wind was below 1 mph? | The report says the downwind station is undetermined below 1 mph. GTA is asking for the percentage of affected intervals, by reach, and a summary of high individual-monitor readings during those periods. |
| Why were there so many monitor power disconnections? | The July report lists roughly 437 cumulative monitor-hours of power disconnections across the project, including about 250 in Reach 7. BPCA should explain the cause and corrective plan. |
| For Action Level 2 events, was work stopped and re-evaluated? | The project's own protocol calls for work stoppage and re-evaluation under specified Action Level 2 conditions. Monthly reports should clearly state when this occurred and what changed before work resumed. |
| Can BPCA provide faster and more transparent public reporting? | The July report was issued on August 28, but only released by BPCA on September 16, 2026. Residents should have near-real-time access to monitor status, exceedance alerts, causes, outages, and corrective actions rather than waiting roughly four weeks for a monthly report. |
How to Read This Dashboard
PM10: Larger dust particles often associated with construction, demolition, soil, and debris.
PM2.5: Finer particles that can be more concerning for people with respiratory or heart conditions.
VOC: Volatile Organic Compounds, generally vapor or chemical-type readings.
15-minute exceedance: A short-term reading above a project action level. It does not necessarily mean the air exceeded a full-day regulatory standard.
24-hour exceedance: A longer-term regulatory exceedance measured over a full day. The reports reviewed did not identify these for PM10 or PM2.5.