Air Quality Monitoring Dashboard-As of June 30, 2026
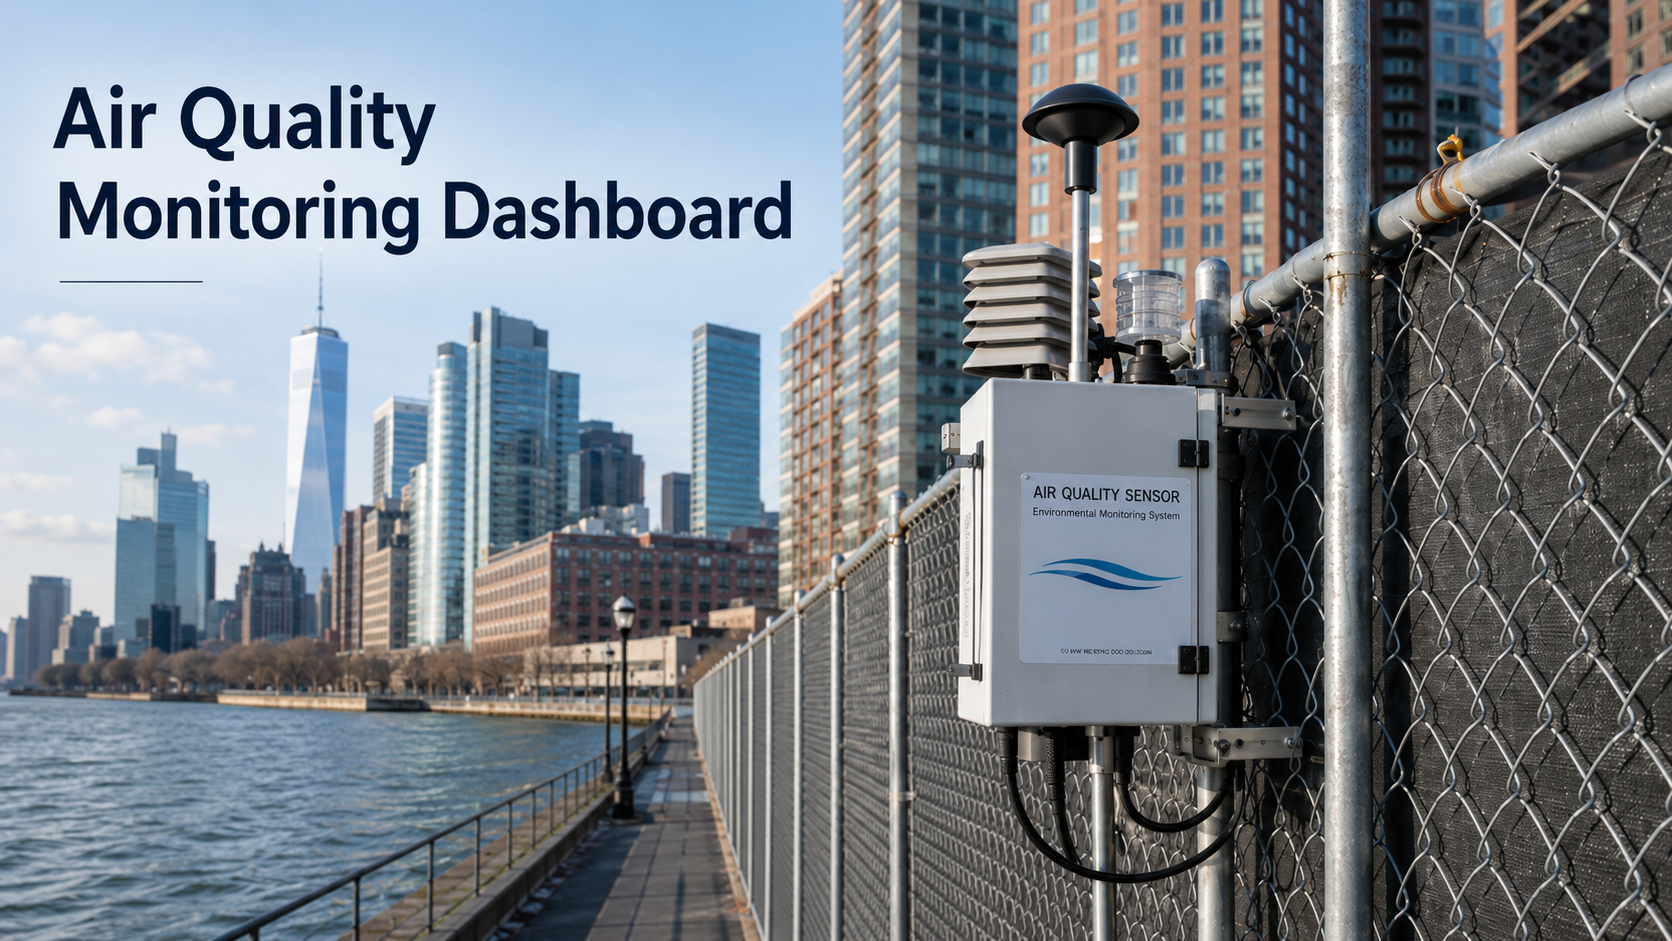
Community Air Quality Monitoring Dashboard
Battery Park City Resiliency Project — Resident-Friendly Monthly Summary
GTA is tracking these reports on behalf of residents because the official air monitoring documents are technical and not easy for most residents to interpret. Our goal is to identify recurring concerns, explain them clearly, and press BPCA and its contractors for reliable monitoring, transparent reporting, and stronger dust prevention before problems affect residents.
First, What Are We Measuring?
The official reports use technical terms like PM10, PM2.5, and VOC. Here is what those mean in plain English.
PM = Particle Pollution
PM stands for particulate matter. In everyday terms, this means tiny particles in the air, including dust, dirt, soot, smoke, or particles created by construction activity.
PM10 = Larger Dust
PM10 refers to larger airborne particles. For residents, this is often the kind of dust most associated with demolition, excavation, soil, debris, and windblown construction material.
PM2.5 = Finer Particles
PM2.5 refers to much smaller particles. These can be more concerning for people with asthma, respiratory conditions, heart or lung conditions, older adults, and young children.
Current At-a-Glance Status
No sustained PM10 or PM2.5 regulatory exceedances reported in the reviewed months.
No vapor or chemical exceedances reported in the reviewed months.
Short-term 15-minute PM events reported in June 2026.
Reach 5 remains the largest hotspot; Reach 1 night work also needs scrutiny.
Monitoring Coverage Concern
GTA is tracking an unresolved monitoring coverage issue near Gateway. On May 8, BPCA announced that work near Gateway would begin on May 11, including excavation, jackhammering, subsurface investigation, tree work, soil sampling, and salvage activities. GTA asked BPCA to confirm whether noise, air, and vibration monitoring was in place for this work. BPCA responded that monitoring was in place.
GTA later learned that noise and air monitoring equipment for this Gateway-adjacent work area was not installed until June 10. BPCA has not yet provided a written explanation for this discrepancy.
June update: The June report appears to confirm that Reach 5E monitoring data began on June 10, 2026 at 1:00 PM. GTA remains concerned that Gateway-adjacent work described by BPCA as part of Reach 5 actually corresponds to Reach 6A North, and that May and early-June report totals may not fully reflect dust, noise, or vibration conditions in that area before June 10.
Why this matters: Until BPCA explains what monitoring was active between May 11 and June 10, the dashboard should be read as a summary of reported monitoring data, not as confirmation that all Gateway-adjacent work areas were fully monitored from the first day of work.
Data Confidence and Transparency Note
GTA summarizes the monthly air monitoring reports for residents in plain English. These dashboard numbers are based on the exceedance entries listed in the official reports; GTA has not independently recalculated every 15-minute reading from the raw monitoring data.
The June report was prepared by Enovate Engineering, identified in the report as a subconsultant to Turner-SPC JV. GTA believes residents would have greater confidence if BPCA provided direct real-time public access to the underlying monitoring data, clearer explanations for exceedance causes, and independent review of monthly results.
GTA is also concerned that the June report is labeled as an R2 file, but the report does not clearly explain what changed from any prior version. For revised environmental monitoring reports, BPCA should publish a brief revision history explaining what was corrected or changed.
The June report was issued nearly a month after the reporting period ended, despite showing the highest number of short-term dust events so far. For months with repeated exceedances, monitor outages, night-work activity, or unusual after-hours readings, residents should not have to wait for the monthly report to learn what happened.
Month-by-Month KPI Summary
| Month | Areas | 24-Hr PM Exceed-ances | VOC Exceed-ances | PM10 Short-Term Events | PM2.5 Short-Term Events | Total Short-Term PM Events | Main Reported Causes | GTA Watch Item |
|---|---|---|---|---|---|---|---|---|
| Dec. 2025 | Reach 5, Reach 6 | 0 | 0 | 15 | 10 | 25 | Paver demolition, site preparation, test pits, Upper Room demolition | Active demolition dust |
| Jan. 2026 | Reach 1, Reach 5, Reach 6 | 0 | 0 | 5 | 0 | 5 | Wind gusts blowing loose soil during off-hours | After-hours soil stabilization |
| Feb. 2026 | Reach 1, Reach 5, Reach 6 | 0 | 0 | 14 | 5 | 19 | Windblown soil, slab demolition, equipment exhaust, saw-cutting/chopping | Dust control and equipment idling |
| Mar. 2026 | Reach 1, Reach 3, Reach 5, Reach 6 | 0 | 0 | 16 | 11 | 27 | Excavation, hand chopping, tree removal, exposed loose soil, wind events | Reach 5 and off-hours wind events |
| Apr. 2026 | Reach 1, Reach 3, Reach 5, Reach 6, Reach 7 | 0 | 0 | 37 | 10 | 47 | Moving equipment, windblown dust, plywood barriers, waterfront work, Pumphouse Park work, subcontractor vehicles/materials, dewatering tanks, tree trimming, concrete deadman work | Sharp increase in short-term dust events; Reach 5 remained highest, Reach 7 newly active, Reach 6/Gateway dewatering-related events |
| May 2026 | Reach 1, Reach 3, Reach 5, Reach 6 Albany, Reach 6 Rector, Reach 7 | 0 | 0 | 75 | 25 | 100 | Construction activities, subcontractor activities, wind-blown dust, concrete demolition, garden-hose/wetted-soil mitigation, improper generator operation, tree/surface demolition and utility-related work | Highest month at that time; Reach 5 remained dominant hotspot, Reach 7 remained active, after-hours/weekend wind-blown dust and monitor outages needed stronger controls |
| June 2026 | Reach 1, Reach 3, Reach 5B/5C/5D, Reach 5E, Reach 6 Albany, Reach 6 Rector, Reach 7 | 0 | 0 | 130 | 64 | 194 | Active construction, Reach 1 night work, wind-blown dust, micropile drilling / Reach 5E, utility work, wetting and dust-control measures | Highest month so far; Reach 5 remains dominant, Reach 1 night work needs scrutiny, Reach 5E monitoring appears to begin June 10, and report-quality / monitor-outage issues require explanation |
Each month, we add a new row to this table and update the four cards at the top of the dashboard. June counts follow the report-listed parenthetical exceedance counts; GTA noted at least one count/timestamp inconsistency in the Reach 5B/5C/5D section.
Monthly Trend: Short-Term Dust Events
These are 15-minute PM10 and PM2.5 exceedance events. They are not the same as sustained 24-hour regulatory exceedances, but they are useful indicators of construction dust-control performance.
PM10 vs. PM2.5 Events
PM10 is larger dust often associated with construction activity. PM2.5 is finer particle pollution and can be more concerning for residents with asthma, respiratory conditions, heart/lung conditions, older adults, and young children.
Where Are the “Reaches”?
The official reports divide the project into construction zones called reaches. Most residents will not know these technical labels, so GTA is translating them into more familiar neighborhood areas.
What Caused the Short-Term Dust Spikes?
| Cause Category | What It Means | Resident Concern |
|---|---|---|
| Active construction activities | The June report attributes most short-term PM events to active construction or construction activities. | BPCA should explain what specific activities caused the spikes and what controls will be strengthened before work continues. |
| Reach 1 night work | The report states that night work occurred in Reach 1, with nighttime working hours between 9pm and 4am. | Night work should have enhanced controls, advance notice, and clear reporting because residents are less able to observe or report conditions while work is underway. |
| Wind-blown dust | Exposed soil or dust can move during gusts, including after work hours, overnight, or on weekends. | Recurring wind-blown dust suggests the need for stronger end-of-day, weekend, and pre-storm stabilization. |
| Micropile drilling / Reach 5E work | The June construction summary identifies micropile drilling in Reach 5E. | GTA is concerned this work may be Gateway-adjacent and may not have been fully monitored before June 10. |
| Dust-control measures / wetting | The report frequently states that contractors implemented dust-control measures or wetted the work area. | Helpful, but repeated exceedances suggest BPCA should explain whether controls are proactive enough before dust spikes occur. |
| Monitor power outages | Several monitors were disconnected from power during June, especially in Reach 5E, Reach 6 Albany, and Reach 7. | Data gaps reduce public confidence and should be minimized with better power management, backup power, or redundant monitoring. |
| Report quality-control issues | The June report includes apparent copy/paste errors and at least one count/timestamp inconsistency. | Accurate reporting matters because residents are relying on these documents to understand construction impacts. |
Resident-Friendly Interpretation
What is reassuring?
- No reported sustained 24-hour PM10 or PM2.5 regulatory exceedances.
- No reported VOC exceedances.
- Most short-term events reportedly returned below action levels by the next monitoring interval.
What remains concerning?
- June had 194 short-term PM events, the highest monthly total so far.
- Reach 5-labeled areas accounted for nearly half of June's reported PM events.
- Reach 1 had a major increase and included night-work activity.
- Reach 5E monitoring appears to begin June 10, raising questions about the May 11 to June 10 monitoring gap near Gateway.
- Many Action Level 2 events were reported without clear public detail about whether stop-work or re-evaluation procedures were followed.
- Wind-blown dust remains a recurring cause across multiple months and reaches.
- Monitor power outages continued in active areas.
- The June R2 report does not clearly explain what changed from any prior version.
- The report appears to contain at least one count/timestamp inconsistency and multiple copy/paste style errors.
GTA Watch List for BPCA / Project Team
| Question / Watch Item | Why It Matters to Residents |
|---|---|
| What explains the June jump to 194 short-term PM events? | June was the highest month reported so far, almost double May. Residents deserve a plain-English explanation of what changed and what will be done differently. |
| What specific corrective actions are being taken in Reach 5? | Reach 5-labeled areas remain the dominant hotspot, with 94 reported short-term PM events in June when Reach 5B/5C/5D and Reach 5E are combined. |
| Was Gateway-adjacent work monitored from the first day it began? | BPCA advised GTA that monitoring was in place when work near Gateway was scheduled to begin on May 11. The June report appears to show Reach 5E monitoring data beginning June 10 at 1:00 PM. BPCA should explain the discrepancy, identify what monitoring was actually active from May 11 to June 10, and clarify whether May and early-June report totals undercount conditions in this area. |
| What exactly changed in the June R2 report? | The file name indicates a revised report, but the report does not clearly explain what changed. BPCA should provide a revision history for any corrected or revised monitoring report. |
| For Action Level 2 events, was work stopped and re-evaluated? | The report's own action-level protocol refers to stopping work and re-evaluating activities under certain conditions. The monthly narrative generally says levels returned below action levels, but does not clearly explain whether stop-work or re-evaluation procedures were triggered. |
| What oversight was in place for Reach 1 night work? | Reach 1 had many June PM events, including late-night and early-morning readings. Night work should be clearly noticed, controlled, monitored, and explained. |
| How is wind-blown dust stabilized overnight, on weekends, and before storms? | Wind-blown dust remains a recurring cause across multiple months and reaches, including off-hour periods. |
| Can monitor power outages be reduced? | June included multiple monitor power disconnections in active areas. Monitoring should be as continuous and reliable as possible. |
| Can report errors or inconsistencies be corrected? | The June report appears to include at least one count/timestamp inconsistency and copy/paste style pollutant errors. Accurate, clear reporting is important for public trust. |
| Can BPCA publish a simple monthly public dashboard? | The official reports are technical and difficult for many residents to interpret. A public-facing dashboard with raw data access, monitor status, exceedance causes, and corrective actions would improve transparency. |
How to Read This Dashboard
PM10: Larger dust particles often associated with construction, demolition, soil, and debris.
PM2.5: Finer particles that can be more concerning for people with respiratory or heart conditions.
VOC: Volatile Organic Compounds, generally vapor or chemical-type readings.
15-minute exceedance: A short-term reading above a project action level. It does not necessarily mean the air exceeded a full-day regulatory standard.
24-hour exceedance: A longer-term regulatory exceedance measured over a full day. The reports reviewed did not identify these for PM10 or PM2.5.