Excel Air Quality Monitoring Dashboard-As of July 31, 2026
Independent Environmental Monitoring Dashboard
Excel Environmental Resources review of the North/West Battery Park City Resiliency Project
BPCA retained Excel Environmental Resources as its independent environmental monitor. Enovate Engineering, the contractor’s monitoring subcontractor, operates the project’s Community Air Monitoring Plan (CAMP) monitoring system. This dashboard translates Excel’s independent findings into plain language and maintains a rolling record as each new monthly report is released.
Latest Month: July 2026 — What Residents Need to Know Now
Excel also continued to report multiple Level 1 events without adequate dust mitigation and Level 2 events where work was not stopped or controls were not re-evaluated as required by the CAMP. July's Canadian wildfire smoke created an additional attribution challenge, making transparent event classification especially important.
This section will always show the six most recent reporting months using the same resident-facing measures. Excel is BPCA’s independent monitor; Enovate operates the contractor’s CAMP monitoring system. As new Excel reports are released, the cards will update and older months will move to the archive.
PM events 46
PM events 47
PM events 139
PM events 100
PM events 193
PM events 194
PM events49*+ >300 wildfire alerts
PM events62†Count QA
*Monitor-count QA note: July involved 25 distinct monitor IDs during the month, but 23 were active at month-end because AM-11 and AM-12 at Reach 6 (Albany St) ended July 7 while AM-30A and AM-31A were added to Reach 2 late in the month.
April — Remote Review Only
Excel reported that it was not yet fully onboarded, conducted no onsite inspections, and did not yet have access to noise data.
May — First Site Visit
Excel conducted one site visit on May 15. It did not observe visible dust during the visit, although remote monitoring showed PM events in Reach 1 and Reach 5 that day.
June — Two Site Visits
Excel inspected on June 5 and June 26. On June 5, it observed visible dust in Reach 5 and said additional water spraying began after Excel raised the concern.
July — Five Site Visits & Two Major Integrity Findings
Excel inspected on July 2, 7, 17, 24 and 29. On July 7, Excel found plastic cups covering AM-02's dust and VOC intakes in Reach 7 and characterized the unit as having been tampered with. On July 24 and 29, Excel observed utility trenching in Reach 2 with no apparent air monitors in place and reminded the project team that CAMP monitors must be installed and operational before work begins.
What “Independent” Means Here
Excel is primarily overseeing Enovate’s contractor-operated network. Excel’s own direct measurements were limited to periodic field inspections rather than a separate 24/7 independent monitoring network. Excel’s scope also indicates that event causes may be relayed as determined by the BPCA project team, so residents should distinguish independent review from fully independent cause attribution.
July — Event Count / Wildfire Classification Needs Reconciliation
Excel reports more than 300 wildfire-related alerts plus 49 non-wildfire PM events. Enovate specifically enumerates 62 PM events outside its broad “numerous wildfire” statements. The 13-event difference corresponds to specifically listed events dated July 15–20, and some of those Enovate entries are individually attributed to construction. GTA recommends an event-level reconciliation rather than a blanket date-based exclusion.
July — Reach 2 Work Before Apparent Monitoring Was In Place
Excel documented utility trenching in Reach 2 on both July 24 and July 29 with no apparent air monitors in place and stated that work cannot begin before CAMP monitors are installed and operational. Enovate says AM-30A and AM-31A were installed July 30, while its appendix data report for Reach 2 begins July 29 at 08:00. That timing discrepancy should be reconciled with the actual GPS/location and device-history records.
July — Obstructed Monitor / Apparent Tampering
Excel found plastic cups covering the dust and VOC intakes on AM-02 in Reach 7 on July 7. The cups were removed after Excel raised the issue. The reports do not state how long the intakes had been obstructed, whether affected data were invalidated, whether an alert or data-quality flag was generated, who placed the cups, or what audit/inspection controls were added afterward.
Actual Monitor Locations Are Not Always Clear
The reports use a mixture of design and apparent as-built monitoring plans, even though the underlying plans state that monitor locations may be adjusted in the field. A dated, “as-operated” monthly map is not provided.
Reach 5E / Reach 6A North
June acknowledges micropile drilling in Reach 5E, but the inspection narratives do not separately document the Gateway-adjacent work area, reconcile the Reach 5E / Reach 6A North designation, or clearly identify which monitors served that work.
Monitor Outages
Enovate reports multiple monitor power disconnections, but Excel’s reports do not provide a resident-friendly monitor-by-monitor uptime and outage ledger. Future reporting should identify the monitor ID, cause and duration of each outage, whether another monitor provided adequate redundancy, whether the outage affected upwind/downwind site-contribution calculations, and when full monitoring was restored.
Negative Readings
April notes negative rolling-average readings attributed to automatic calibration overcorrection. Excel says they should be treated as zero but does not quantify how often this occurred.
Power Availability Trend
Based on GTA’s reconstruction of Enovate appendix data, documented power availability was approximately 93.9% in May, 98.0% in June, and 97.2% in July. July contains approximately 437 documented power-disconnection monitor-hours, including about 250 hours in Reach 7. These figures capture only periods Enovate explicitly labels as disconnected from power and do not include other causes of unavailable or invalid monitoring.
Low-Wind Conditions Can Limit Site Attribution
Enovate states that when wind speed falls below 1 mph, the downwind monitor is considered undetermined and site contribution cannot be calculated for that interval. GTA’s review of Enovate’s published wind-rose summaries found very low-wind conditions were common. In June, 21 of 34 wind-rose reporting blocks (62%) showed calm and/or sub-2 mph conditions for at least half of the reporting period.
Because Enovate groups winds below 2 mph rather than separately reporting the exact time below 1 mph, the percentage of intervals in which site contribution was unavailable cannot be determined from the published reports.
Important: The 62% figure is a low-wind screening indicator, not a measure of the percentage of time site contribution was unavailable.
What the Reports Do Provide
Excel identifies events where stronger mitigation, work stoppage, BMP re-evaluation, or other action should have occurred.
What Is Missing
A resident-friendly corrective-action register: date, issue, required response, who was notified, what was done, when Excel verified it, and whether the item is open or closed.
July Corrective Recommendations
Excel specifically recommended: ensure all plan-specified monitors are installed and operational before work begins; inspect sensors and intakes each day for obstruction; immediately rectify and document any issue; consistently follow CAMP stop-work requirements; and improve preventive wetting/covering of exposed soil and stockpiles.
1. Reconstruct Reach 2 Monitoring Coverage
Provide the native Aeroqual/OneView device and location history for Reach 2, including the exact installation/activation times for AM-30A and AM-31A, GPS coordinates, data timestamps, and an explanation for why Enovate's appendix report begins July 29 at 08:00 while its narrative says the monitors were installed July 30 and Excel observed no apparent units on July 29.
2. Investigate the AM-02 Obstruction / Tampering Event
Determine how long AM-02's PM and VOC intakes were covered, who placed the cups, whether data from the affected period were flagged or invalidated, whether OneView generated sensor/data-quality alerts, and what physical/audit controls were implemented afterward.
3. Document Every Level 2 Stop-Work Response
For each Level 2 event, identify whether work actually stopped, what BMPs were re-evaluated, when readings returned below threshold, and when work resumed. Excel again states in July that these procedures were not consistently followed.
4. Publish As-Operated Monitor Maps, GPS History & Downtime
Provide dated actual monitor locations—not only design locations—plus installation, relocation and removal times, GPS/location history, and all periods of unavailable or invalid monitoring. July makes this especially important.
5. Publish Power / Health / Alert Logs
For each documented power disconnection, provide low-voltage warnings, offline alerts, recipients, response times, restoration times and whether local data were recovered. July contains about 437 documented power-disconnection monitor-hours.
6. Reconcile July Wildfire and Project Event Counts
Reconcile Excel's 49 non-wildfire PM events with Enovate's 62 specifically enumerated events outside its broad wildfire statements, particularly the 13 events dated July 15–20 and the cause assigned to each.
7. Publish Site-Contribution Availability
Report, by Reach and month, the percentage of valid 15-minute intervals in which wind conditions and monitor geometry allowed a meaningful upwind/downwind site-contribution calculation, including intervals excluded for wind below 1 mph.
8. Complete Independent Noise Oversight
Explain why Excel still had not received noise data or reports as of July, when full access began, whether April–July will be reviewed retroactively, and how noise alerts/corrective actions will be reported.
9. Track Corrective Actions to Closure
Publish an event-by-event corrective-action register showing issue, required response, party notified, action taken, Excel verification date, and open/closed status.
10. Clarify Reach 5E / Reach 6A North Coverage
Explain which monitors covered Gateway-adjacent work, their actual coordinates and dates, how Reach 5E and Reach 6A North terminology should be reconciled, and whether the configuration provided meaningful receptor and upwind/downwind coverage.
This reference section explains the technical shorthand used above. Linked terms throughout the dashboard jump here for readers who want more detail.
Community Air Monitoring Plan (CAMP)
The project's CAMP establishes how construction-related air monitoring is performed and sets short-term response thresholds known as Action Levels. The purpose is to trigger protective action during construction when particulate levels rise.
↑ Back to topPM / Particulate Matter
PM means particulate matter: tiny airborne solid particles and liquid droplets. The dashboard counts short-term PM Action Level events reported by the project monitors; these are not automatically the same thing as violations of longer-term regulatory air-quality standards.
↑ Back to topPM10
PM10 refers to inhalable particles with aerodynamic diameters generally 10 micrometers or smaller. Construction dust can contribute to PM10, which is why the CAMP monitors it separately.
↑ Back to topPM2.5
PM2.5 refers to fine particles with aerodynamic diameters generally 2.5 micrometers or smaller. These particles are smaller than PM10 and are monitored under their own CAMP thresholds.
↑ Back to topAction Level 1
Level 1 is the lower CAMP response threshold. When construction-related particulate levels reach this level, the plan calls for additional or re-evaluated dust-control measures while work may continue only under the applicable CAMP conditions.
↑ Back to topAction Level 2
Level 2 is the higher CAMP response threshold. After required suppression efforts, an applicable Level 2 condition requires work to stop, controls to be re-evaluated, and work to resume only after particulate conditions are reduced below the applicable threshold and visible migration is controlled.
Why GTA highlights it: Level 2 events provide an especially important test of whether the project's required protective response was followed.
↑ Back to topSite Contribution / Upwind & Downwind
The contractor compares upwind and downwind readings to estimate the portion of particulate levels that may be attributable to construction. Wind direction is therefore central to the calculation. When wind is too light to determine a downwind station, the project may be unable to calculate a site-contribution value even though raw monitor readings still exist.
GTA has therefore asked BPCA to explain the siting rationale for each reach and to provide dated, as-operated monitor locations together with wind direction, monitor relocations, outages, and any supplemental or mobile monitoring used when fixed locations do not create a meaningful upwind/downwind comparison.
The dashboard does not characterize west-to-east winds as the prevailing condition for all periods unless supported by the project's own meteorological data. The concern applies specifically during periods when wind direction makes a north–south monitor pair crosswind rather than upwind/downwind.
↑ Back to topLow-wind reporting limitation: Enovate’s wind-rose summaries group conditions into “calm” and “<2 mph” categories, while the CAMP site-contribution cutoff is <1 mph. As a result, the published reports do not provide enough detail to calculate the exact percentage of intervals when site contribution was unavailable because of low wind.
Excel Site Inspection
A site inspection is an onsite visit by Excel, BPCA's independent monitor. Excel also reviews the contractor's monitoring data remotely. A site-inspection count therefore should not be read as the number of days environmental monitoring occurred; the contractor-operated monitors run separately.
↑ Back to topNoise Alerts / Noise Review
This dashboard reports noise information only when Excel's monthly reports provide enough information to do so. Excel reported no noise-monitoring access in April or May, said it was reviewing noise reports in June, and stated that as of July it still had not been provided noise data or noise reports by Turner or Enovate. “Not available” does not mean zero noise events.
↑ Back to topPublic Reporting Delay
The reporting-delay figure is normally the number of days from the end of the reporting month to the date shown on Excel's public monthly report. July's Excel report leaves the REPORT DATE field blank, so GTA does not invent a July delay figure.
↑ Back to topWhere Is the Work? Understanding the Project Reaches
The project is divided into numbered construction areas called Reaches. The visual below is more intuitive for community use because it shows the full Battery Park City project alignment and all seven reaches.
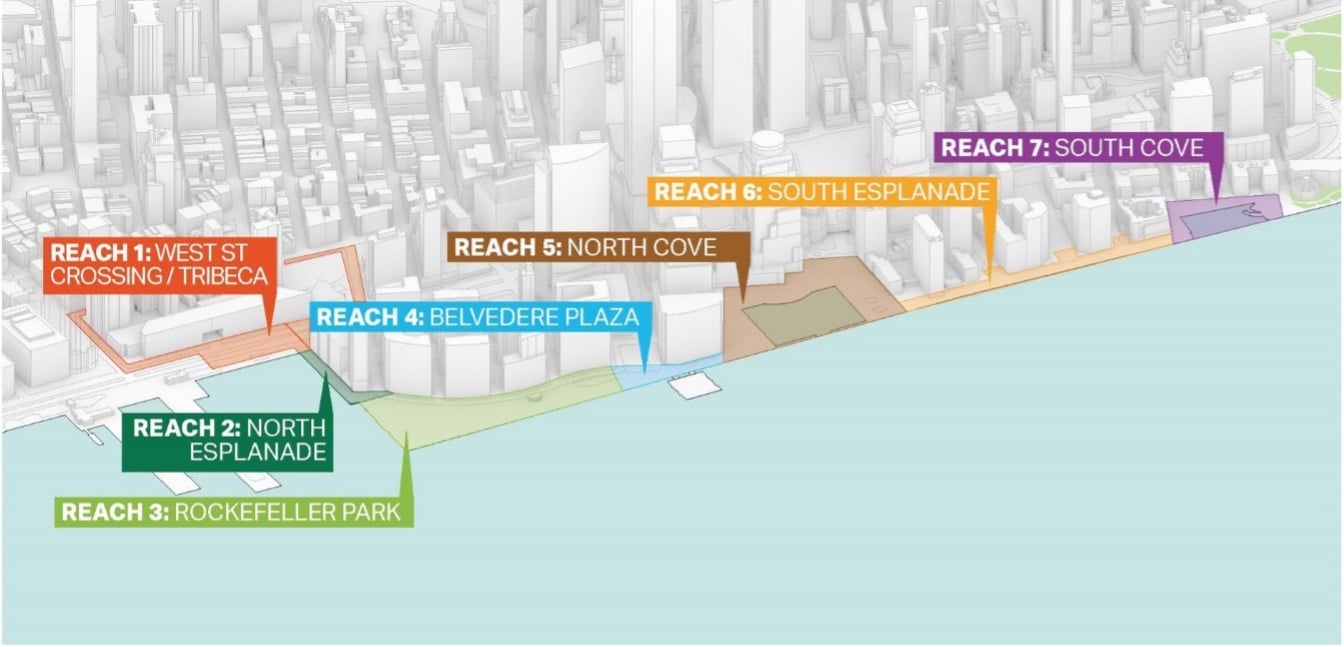
Why this matters: environmental-monitoring results, monitor locations, outages, work activities and Excel observations are often reported by Reach rather than by familiar building, park or street name.
- Reach 1 — West Street Crossing / Tribeca
- Reach 2 — North Esplanade
- Reach 3 — Rockefeller Park
- Reach 4 — Belvedere Plaza
- Reach 5 — North Cove
- Reach 6 — South Esplanade
- Reach 7 — South Cove
What the Excel reports now cover: by July, Excel reported monitoring activity across all seven project reaches. July also exposed an important coverage issue in Reach 2, where Excel observed utility trenching on July 24 and 29 with no apparent air monitors in place.
Reach 5E / Reach 6A North: the Gateway-adjacent area deserves particular care in interpreting the reports. Excel’s June work summary identifies micropile drilling in Reach 5E, while other project materials and community discussion also refer to the nearby area as Reach 6A North. The dashboard flags this as a monitoring-documentation issue rather than silently treating the names as interchangeable.
Resident-facing recommendation: future independent reports should include a dated “as-operated” map showing the actual location of every active air, noise and vibration monitor, along with installation, relocation, removal and outage dates.